
Overview
A live dashboard of California's power grid, built from CAISO's public five-minute data.
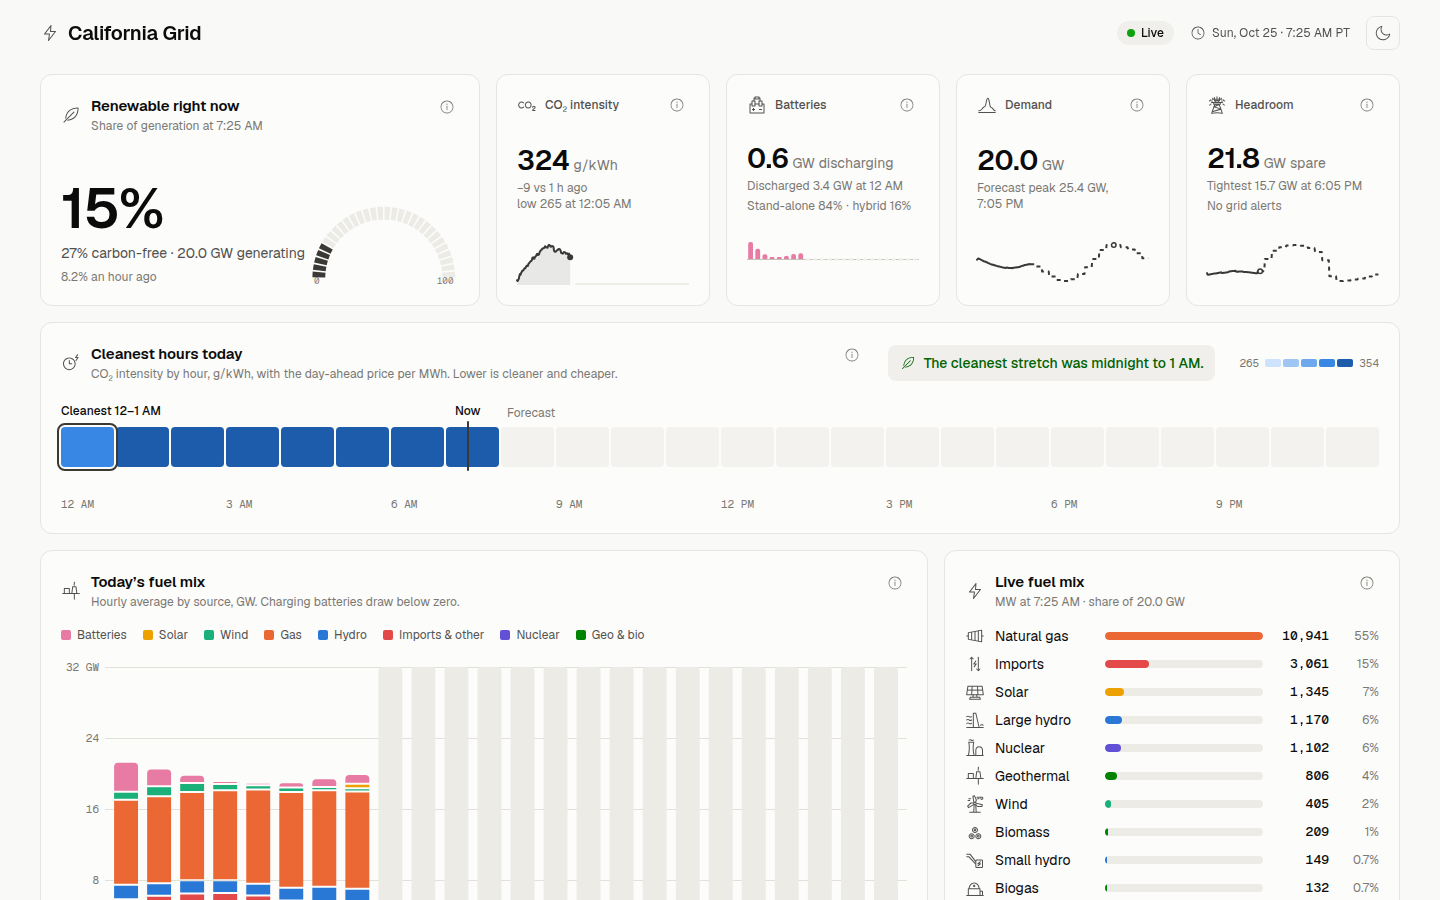
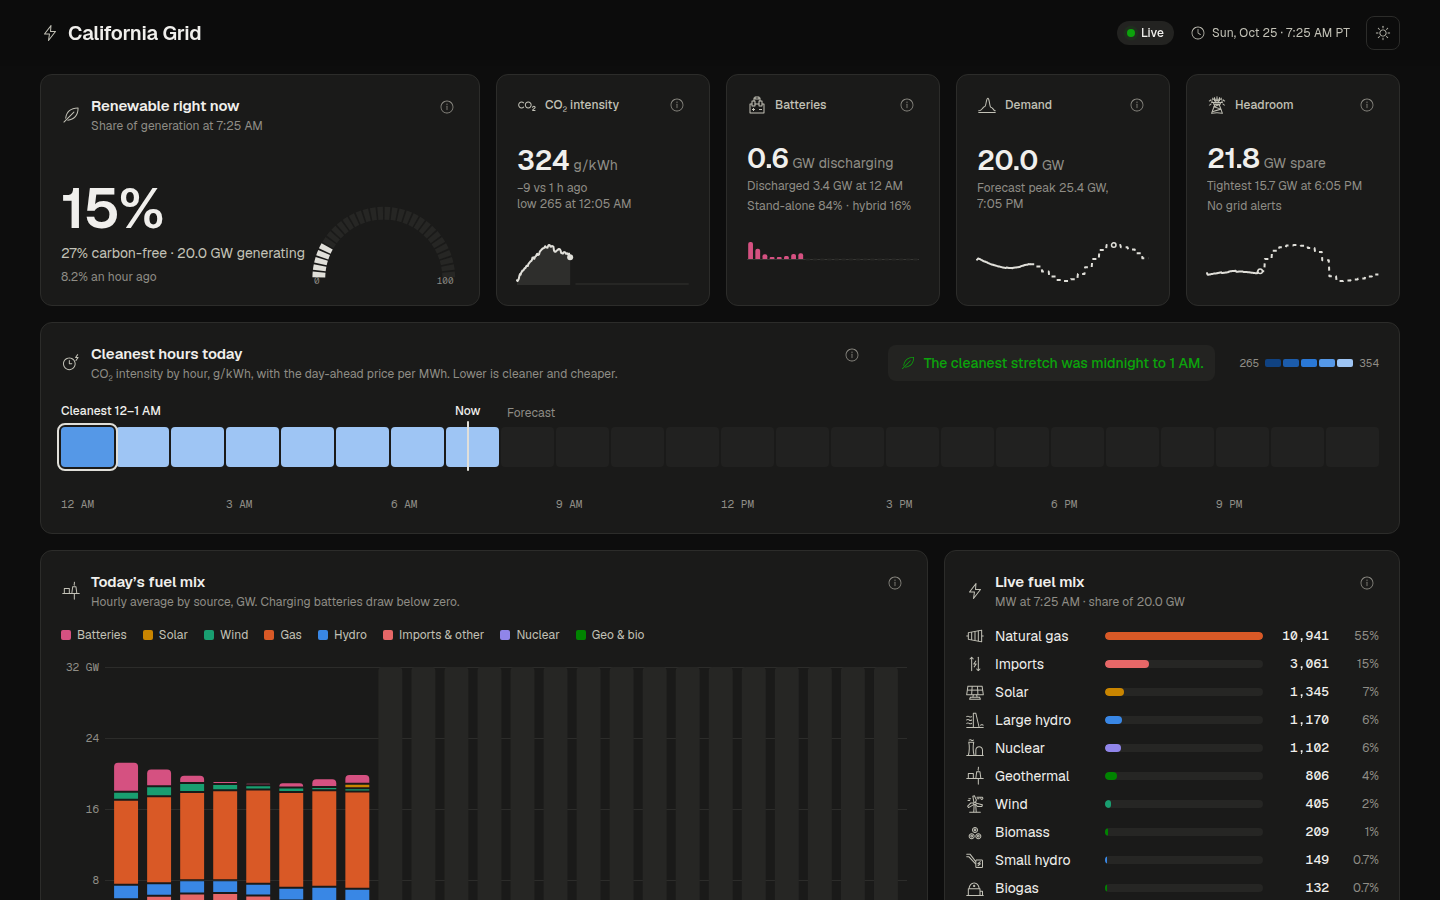
California Grid is a live view of the state’s power grid. It reads CAISO’s public Today’s Outlook and OASIS data every five minutes and shows how much of the power is renewable, how much CO₂ each kilowatt-hour carries, what the batteries are doing, and how much spare capacity the grid has left.
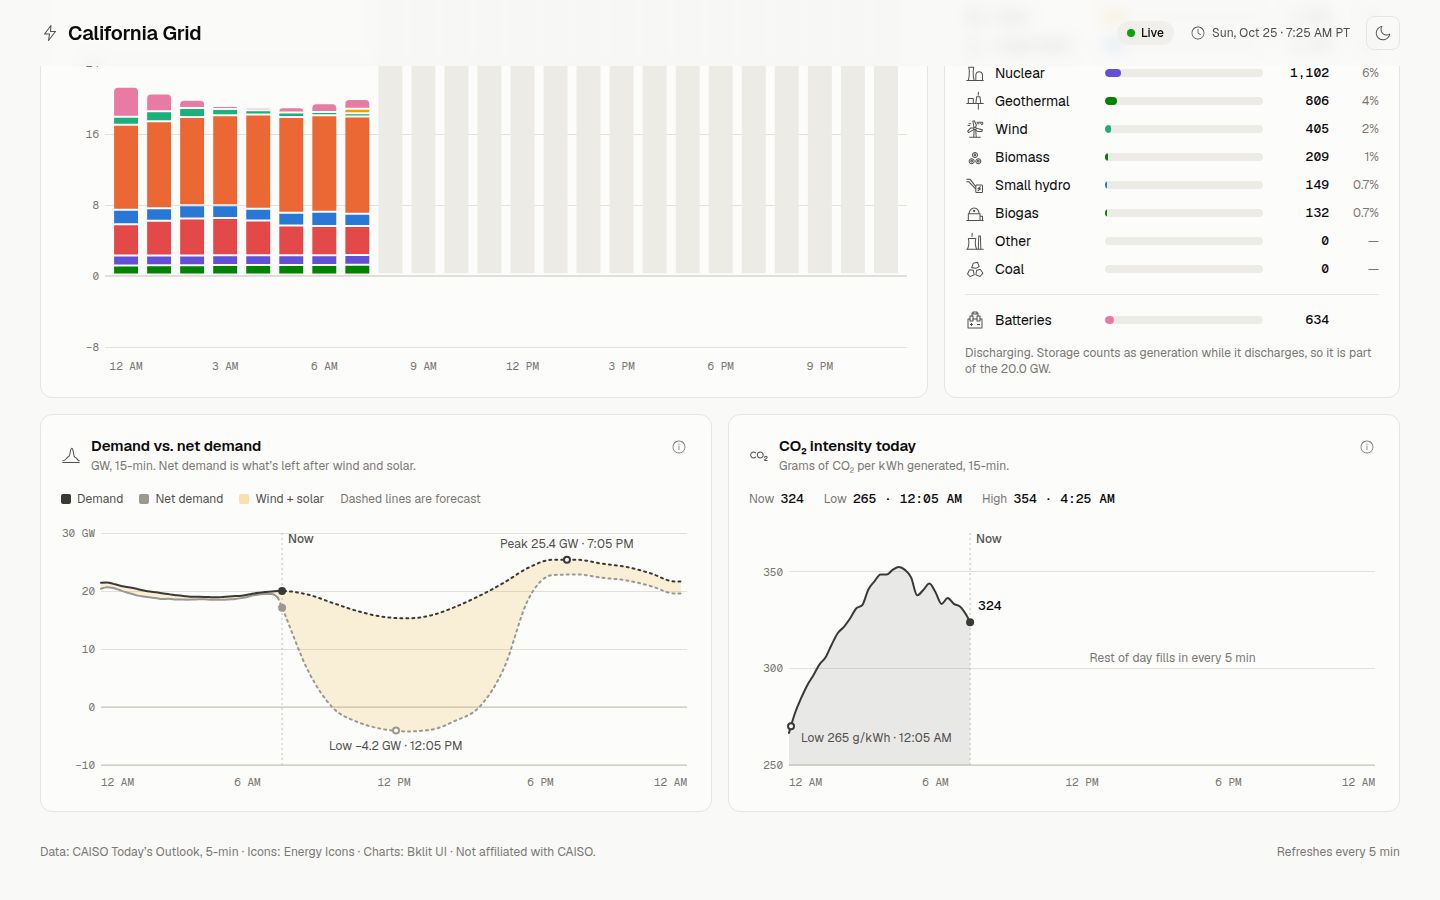
A strip of today’s hours marks the cleanest stretch of the day next to the day-ahead price, so anyone charging a car or running a dryer can see when the grid is cleanest and cheapest. Charts below break the day down by fuel, compare demand with net demand after wind and solar, and track CO₂ intensity hour by hour.
- Date
- OCT, 2026
- Stack
- FastAPI, Postgres, React, Tailwind
- Services
- Custom Software · Web Design & Development
The work
How it was built
Show what California's grid is doing right now, and when today's power is cleanest and cheapest, from CAISO's public data.
A poller stores CAISO's five-minute fuel mix, demand, storage and CO₂ feeds, plus day-ahead forecasts and prices. The API derives the renewable share, CO₂ intensity, battery output and spare capacity per request, and the page refreshes every five minutes.
FastAPI and SQLAlchemy over Postgres for the data, so the history can be backfilled and queried by day. React with TanStack Query and Tailwind for the page. Docker Compose behind Caddy, self-hosted on Coolify.